


From Data to Decisions
Impact connects to existing city and agency datasets, processes them through advanced models, and delivers results in clear, human-readable visualizations. Leaders gain a structured view of complex issues, the ability to test different scenarios, and a shared foundation for communicating decisions across teams and stakeholders.
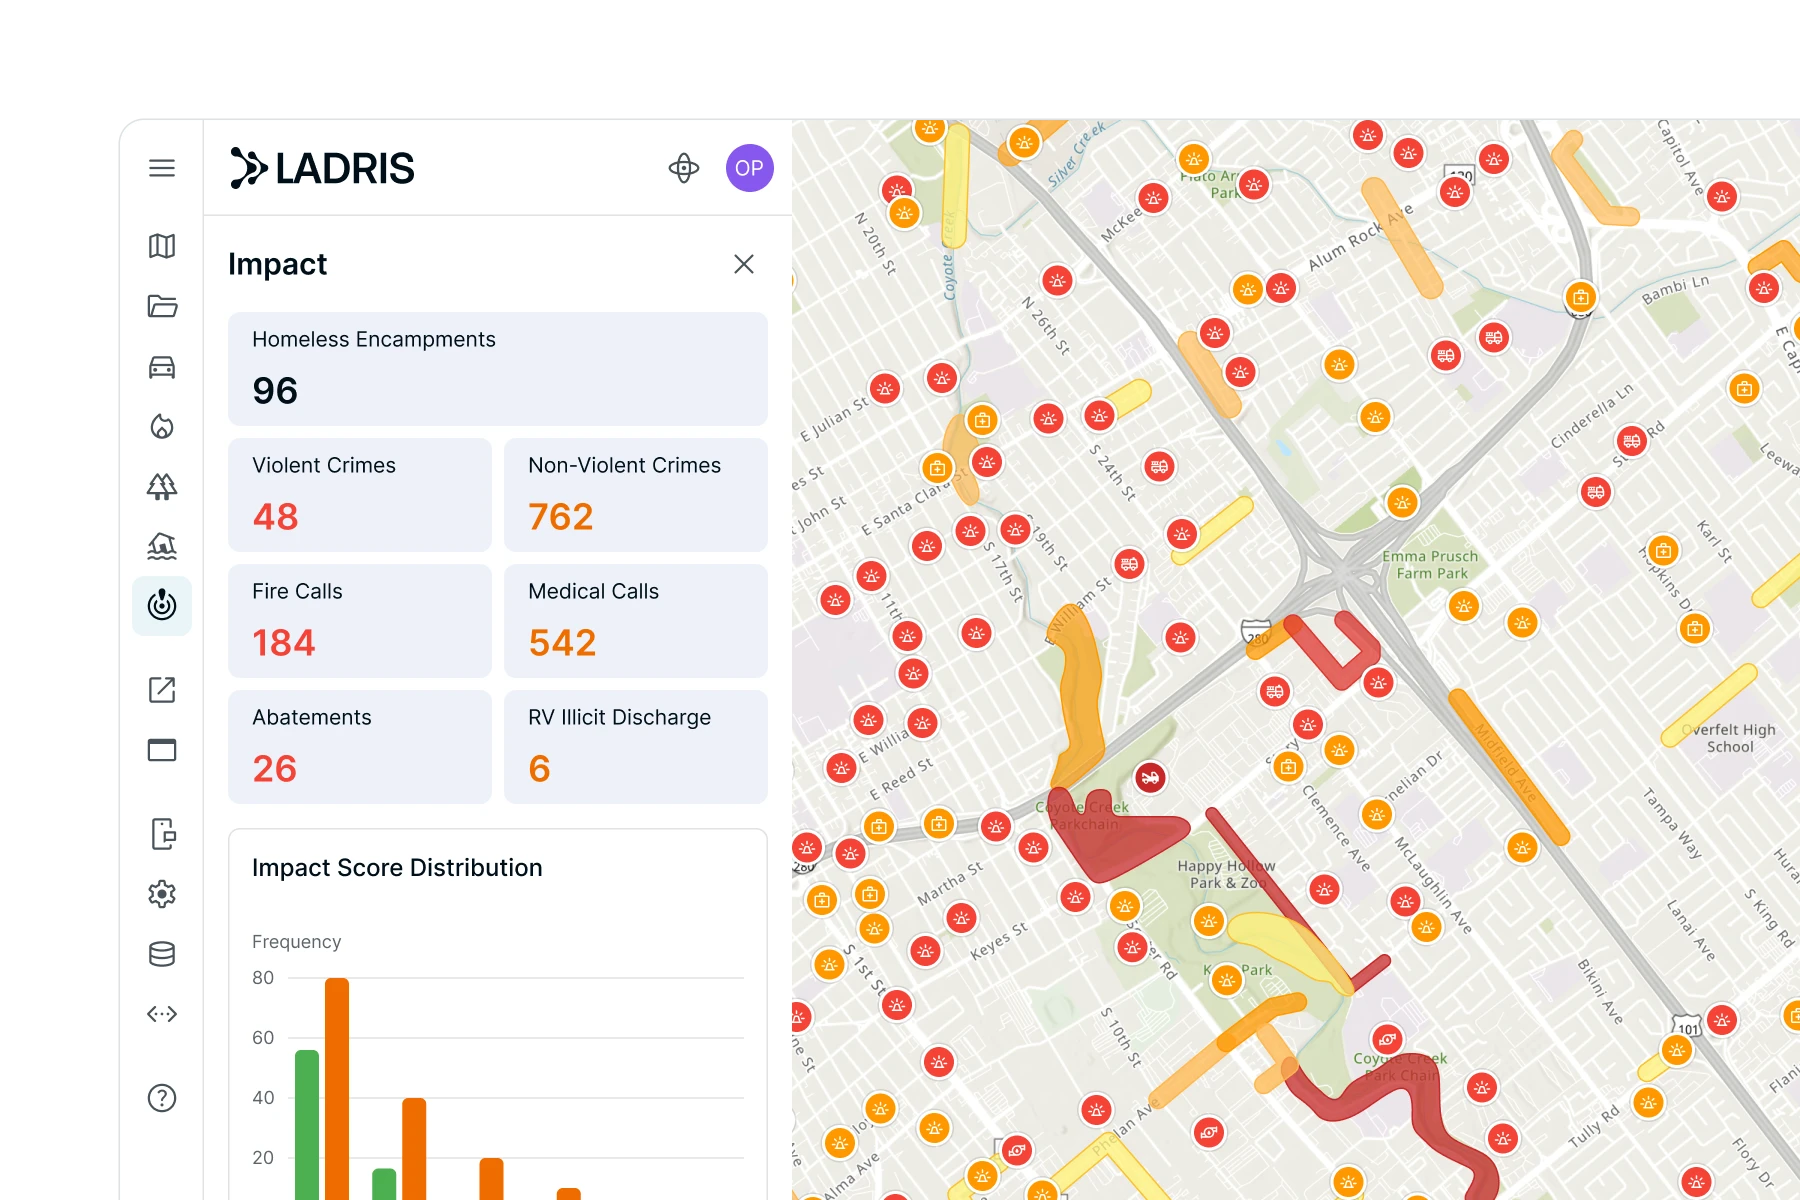
Data Integration
Bring Data Together
Connects housing, safety, environmental, and infrastructure datasets into a single intelligence framework.
Advanced Analysis
Apply Advanced Analysis
Models process and interpret the data, revealing trends, relationships, and potential outcomes that may not be visible in raw numbers.
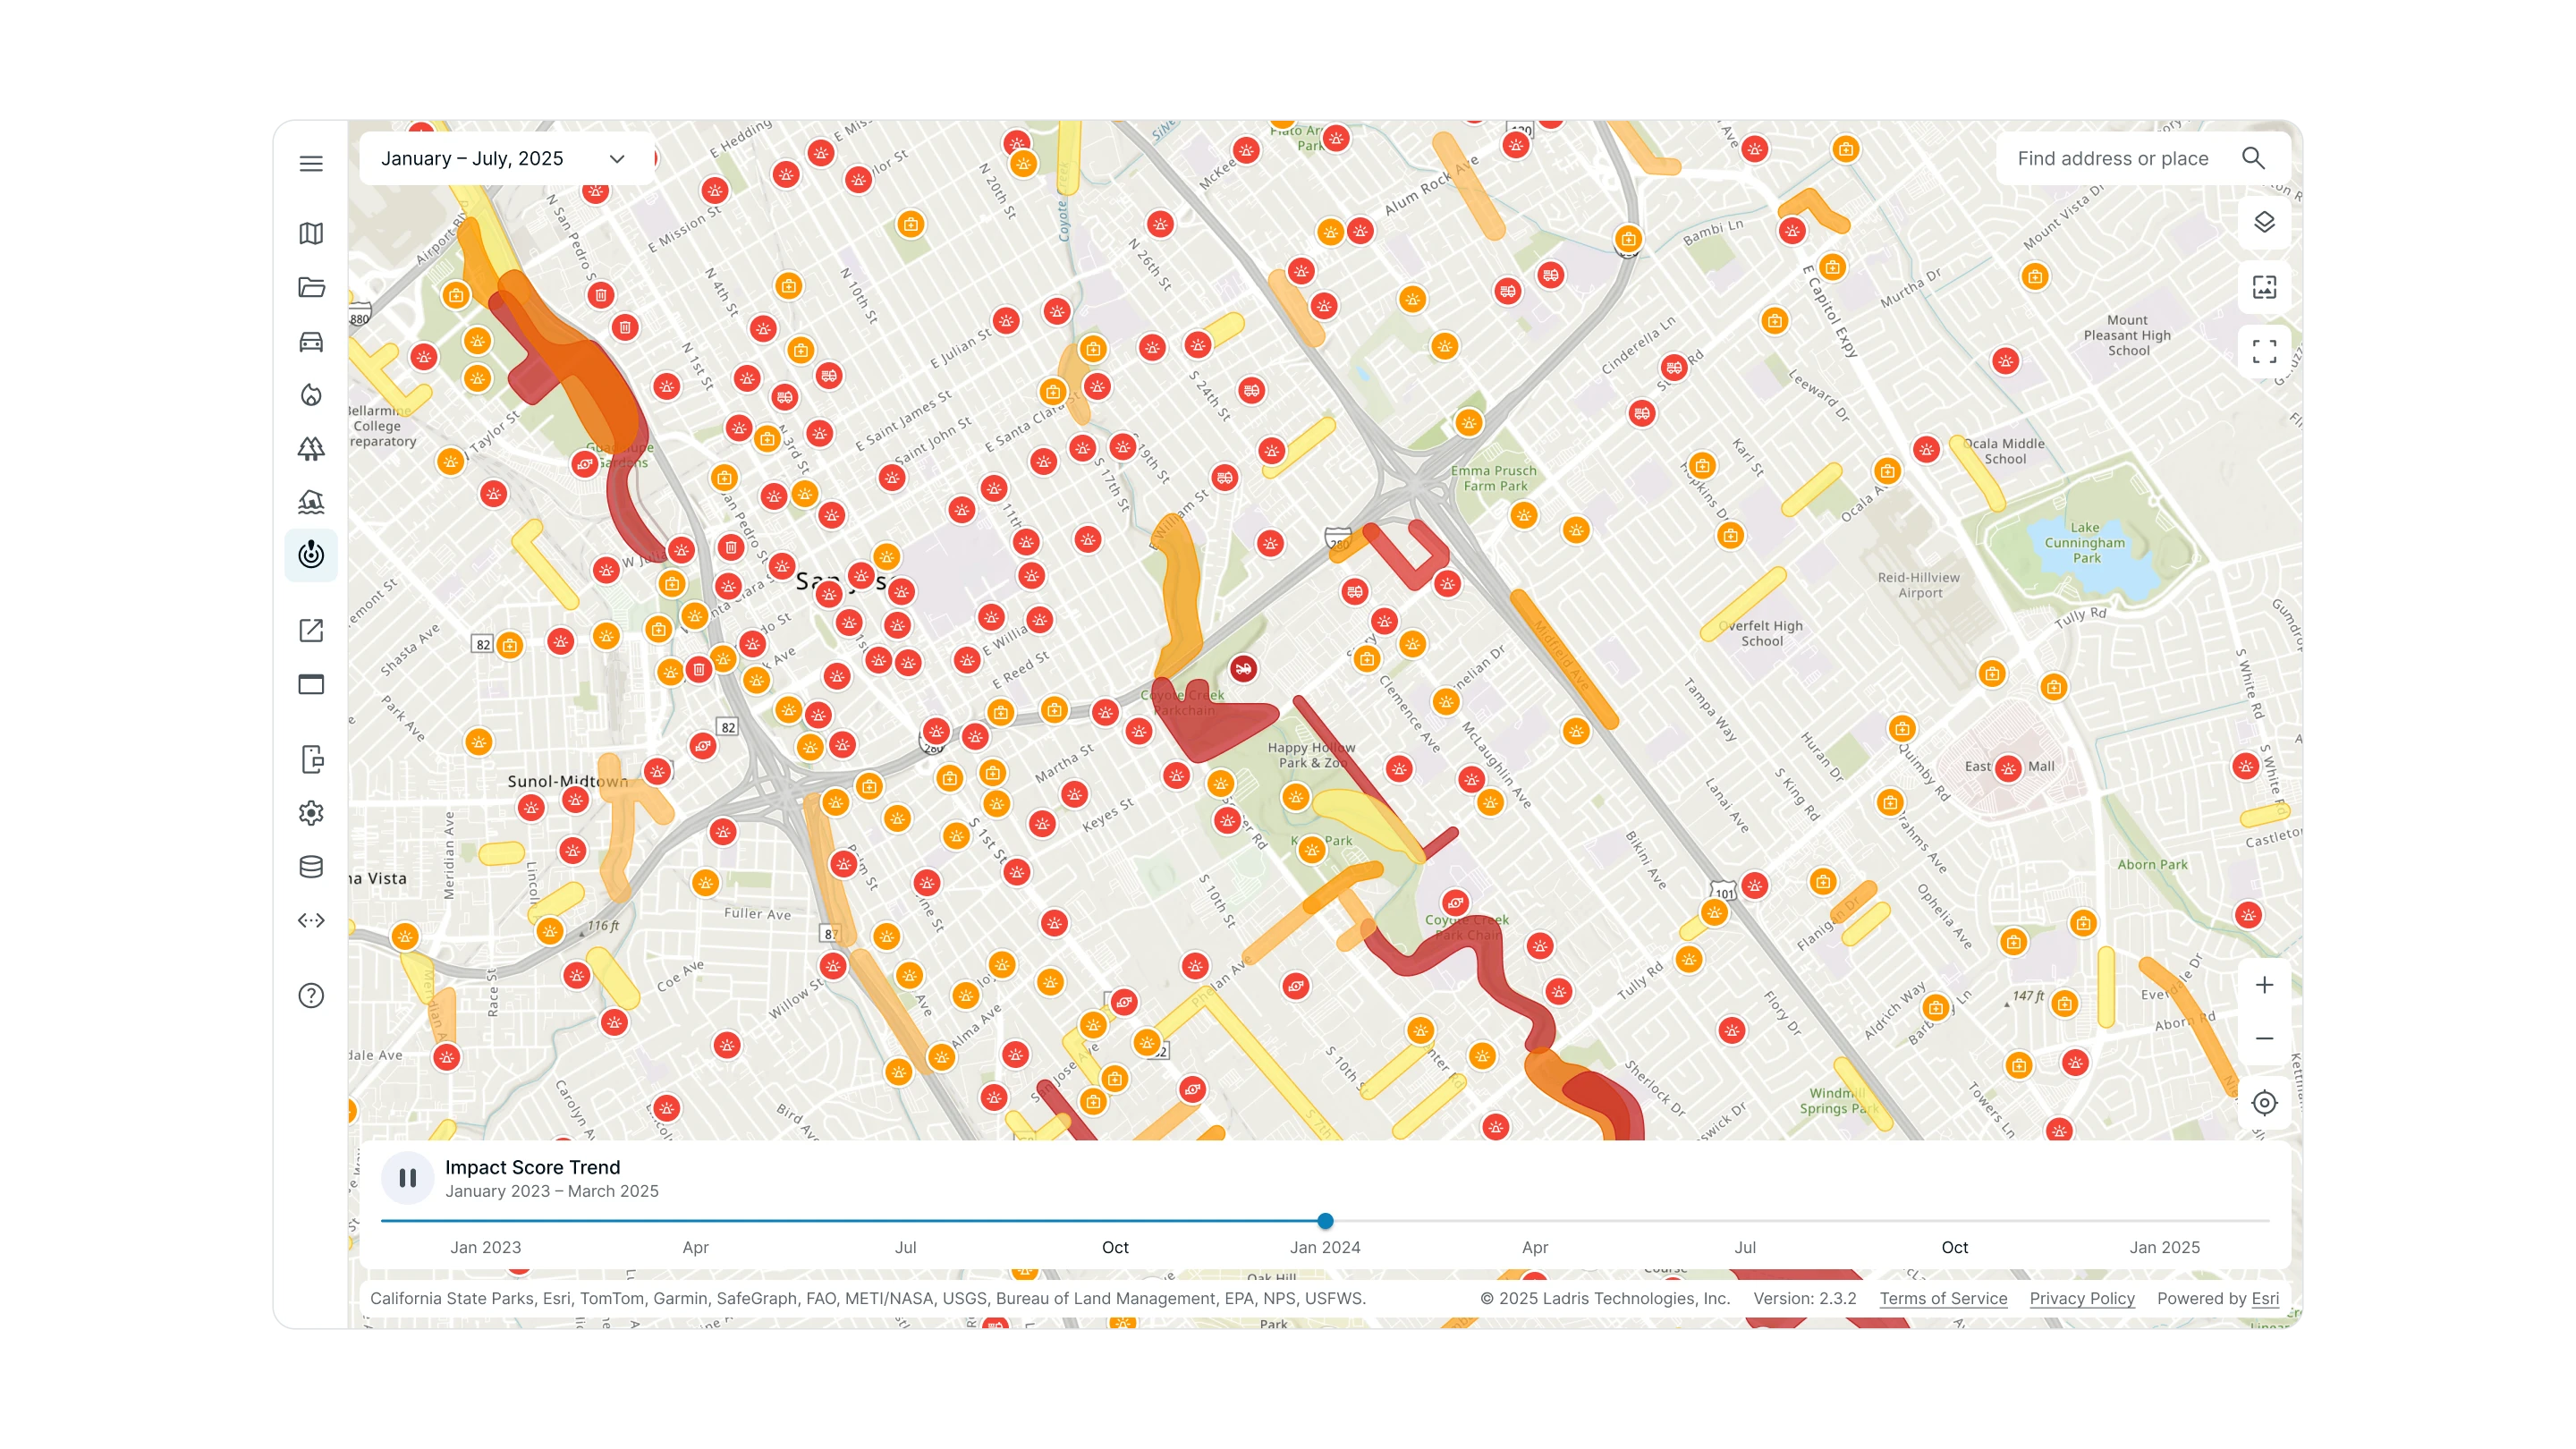
Visualization
Communicate with Clarity
Results are delivered as human-readable insights and intuitive visualizations — making complex issues easy to understand and act on.
Key Advantages
Complex Problems, Clear Answers

Customizable to Local Priorities
Every jurisdiction faces different challenges. Impact can be tailored to focus on homelessness, carbon footprint, emergency management, or other pressing issues — aligning forecasts with your specific policy and program needs.
Tell a Story with Your Data
Impact unifies fragmented datasets, runs them through advanced models, and presents outcomes in a format that decision-makers and the public can understand. Complex problems become clear, actionable narratives.
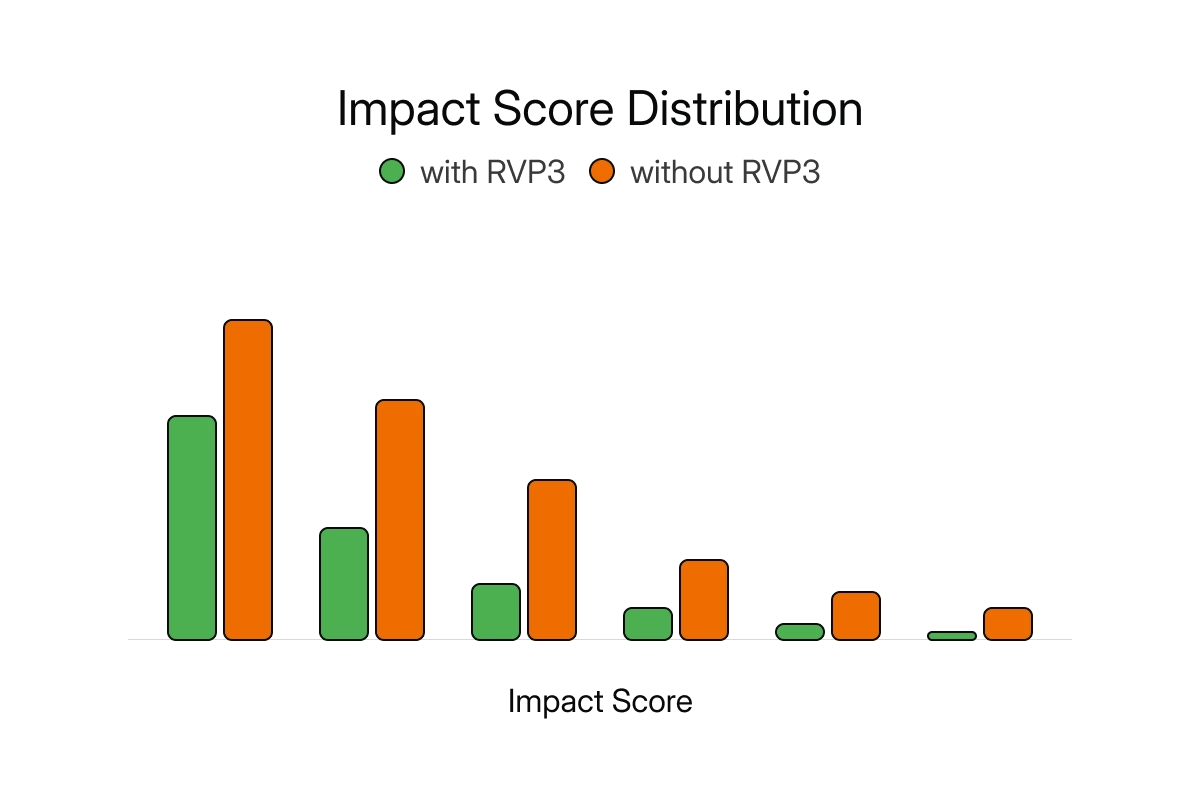
Visualize What Success Looks Like
Beyond forecasting, Impact illustrates the effect of new investments or policy changes — whether reducing risk, improving equity, or strengthening resilience. Leaders can show stakeholders measurable progress every step of the way.


Built for Leaders Who Must Deliver Results
Impact supports organizations that need to plan smarter, act faster, and prove the value of their initiatives. Built for leaders facing complex challenges who must demonstrate measurable results to stakeholders and the public.

Data in Silos
Housing, infrastructure, and environmental data often live in separate systems, limiting visibility and slowing response.
Pressure to Prove Outcomes
Public programs require accountability. Impact makes it possible to track results and demonstrate value.
Communicating Complexity
Technical reports are difficult to translate. Impact turns them into clear, visual insights that inform decisions and build trust.
© 2026 Ladris Technologies, Inc. All Rights Reserved.


